Ampicillin is a β-lactam antibiotic that almost every molecular-biology laboratory keeps in stock, not to treat infection but as a selection marker. A plasmid carrying a bla (β-lactamase) gene lets only transformed cells survive on ampicillin-containing medium. That selection step depends on a quiet assumption: the ampicillin in the bottle is actually ampicillin, at the potency the label claims.
This worked example compares two commercial ampicillin products by ¹H NMR and shows how a single, quick spectrum distinguishes a clean product from a compromised one — before either is trusted with a cloning experiment.
Why purity is not a detail here
When ampicillin is used for selection, its job is to kill or arrest every cell that does not carry the resistance marker. Two failure modes follow directly from impurity:
- Lower effective potency. If a fraction of the material is hydrolysed β-lactam or other inactive by-products, the true concentration of active ampicillin is below the nominal value. The selection stringency drops, and slow-growing or satellite colonies (cells surviving in the detoxified halo around a resistant colony) become far more likely.
- Misleading troubleshooting. A plate overgrown with satellites looks like a biology problem. When the real cause is a degraded antibiotic, time is spent chasing the wrong variable.
For a selection marker you therefore want the purer product. Identity and potency are the whole point; there is no “close enough.”
The evidence
Both products were dissolved in DMSO-d₆ and their ¹H NMR spectra recorded under comparable conditions on the same day. The two traces are stacked below, on a shared chemical-shift scale referenced to the residual DMSO-d₆ resonance at 2.50 ppm (Cambridge Isotope Laboratories NMR Solvent Data Chart).
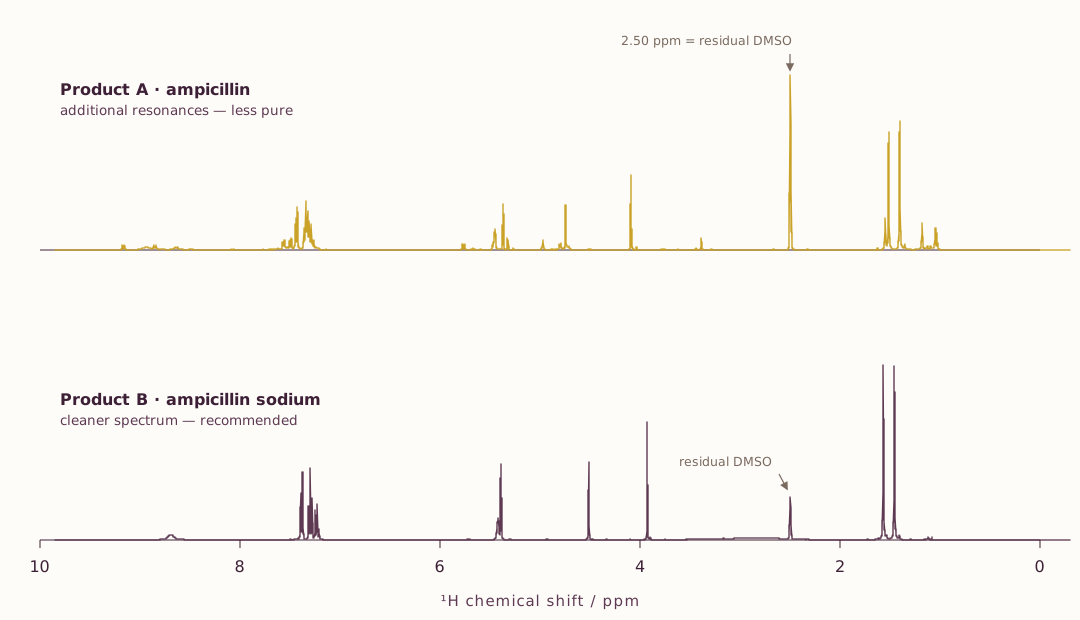
Figure 1. ¹H NMR spectra (DMSO-d₆) of two commercial ampicillin products on a shared chemical-shift axis (full recorded window, 0–10 ppm shown). Traces were recovered from the source vector data and rendered with local file paths and acquisition titles removed; the chemical-shift scale was re-referenced so that the residual DMSO-d₆ resonance falls at 2.50 ppm (Cambridge Isotope Laboratories NMR Solvent Data Chart). Product B was plotted at a relative display scale of 0.1891, so absolute peak heights are not comparable between the two traces — only the number, position, and cleanliness of the resonances should be read. The tall resonance at 2.50 ppm, marked with arrows, is residual DMSO solvent.
What each region shows
| Region / ppm | Product B (sodium, clean) | Product A (less pure) |
|---|---|---|
| 8.7–9.2 (exchangeable NH) | One weak signal near 8.7 ppm | Several extra weak signals (≈ 8.8, 8.9, 9.2 ppm) |
| 7.3–7.6 aromatic (phenyl, 5H) | One tidy multiplet centred near 7.35 ppm | Broader multiplet with extra shoulders extending to ≈ 7.6 ppm |
| 5.3–5.8 (β-lactam CH) | One clean resonance near 5.4 ppm | A split cluster (≈ 5.4, 5.5 ppm) plus an extra signal near 5.8 ppm |
| 3.9–5.0 (methine CH) | Two sharp singlets near 3.9 and 4.5 ppm | Shifted/split signals (≈ 4.1, 4.7 ppm) plus extra peaks near 5.0 ppm |
| 1.4–1.6 (gem-dimethyl) | Two sharp singlets at 1.46 and 1.57 ppm | Present, but accompanied by extra upfield peaks (≈ 1.0, 1.2 ppm) |
| 2.50 | Residual DMSO solvent (present in both traces) | Residual DMSO solvent (present in both traces) |
Product B gives the spectrum expected of ampicillin: two sharp methyl singlets (1.46, 1.57 ppm), clean methine resonances (≈ 3.9, 4.5, 5.4 ppm), and a tidy phenyl multiplet (7.3–7.4 ppm), with a flat baseline elsewhere. Product A shows the same core pattern — some resonances slightly shifted, as expected when the salt form or protonation state differs — but adds extra resonances upfield (1.0–1.2 ppm), a split and crowded methine/β-lactam region (4.7–5.8 ppm), extra exchangeable signals (8.8–9.2 ppm), and shoulders on the aromatic multiplet: the signature of a sample carrying structurally related impurities or degradation products.
The decision
Use Product B (the ampicillin sodium salt). Its spectrum is the cleaner of the two: fewer, sharper resonances and a flat baseline, meaning less inactive or interfering material per unit weight. For a selection marker, that translates directly into more reliable stringency and fewer satellite colonies.
Product A is not necessarily useless — the main resonances are present, so it is largely ampicillin — but its extra resonances mean the active concentration is lower and less certain than the label implies. It is the wrong choice when selection depends on a known, reliable dose.
Limitations
- This comparison rests on a single ¹H spectrum per product in one solvent; it is a qualitative purity screen, not an assay.
- The two traces were plotted at different display scales (Product B at 0.1891), so peak heights cannot be compared quantitatively. No internal integration standard was used, so no molar purity percentage is reported.
- ¹H NMR detects proton-bearing impurities but is insensitive to inorganic salts and does not by itself prove stereochemical integrity. A quantitative assay (e.g. qNMR with a certified standard, or HPLC against a reference) would be needed to assign an exact purity value.